
More than 99% of coastal hazard studies published over the past 16 years may have been working from a flawed foundation — and the consequences for how we understand flooding risk along the world’s coastlines could be significant.
That is the central finding of a new peer-reviewed analysis from Wageningen University & Research, which reviewed 385 coastal hazard papers published between 2009 and 2025. The researchers, Katharina Seeger and Philip Minderhoud, found that the vast majority of those studies handled sea level and land elevation data in ways that can distort results — potentially making some coastlines appear safer than they actually are.
The core issue sounds technical, but its implications are anything but. If the starting point used to measure sea level rise is even slightly off, every projection built on top of it inherits that error.
The Baseline Problem That’s Been Hiding in Plain Sight
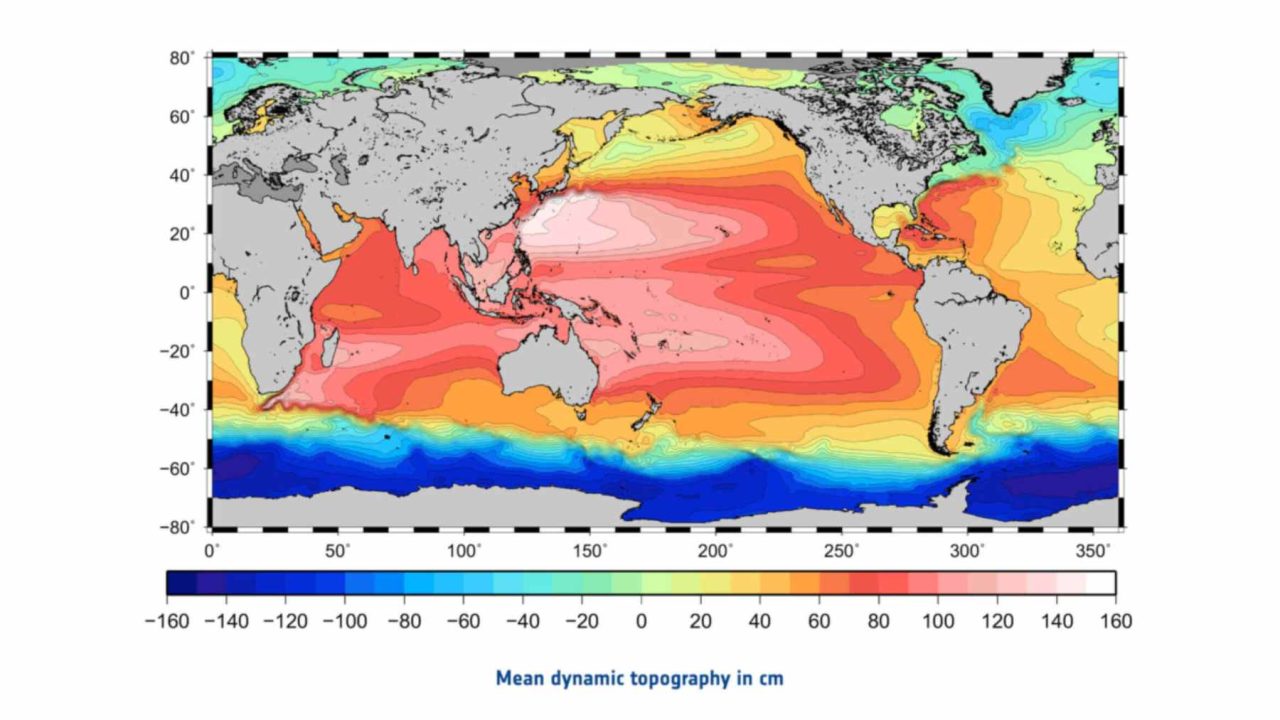
Coastal flood risk is, at its most basic level, a comparison. How high is the ocean? How high is the land beside it? The difference between those two numbers tells you how vulnerable a coastline is — now, and as sea levels climb.
The problem identified by Seeger and Minderhoud is that many studies skip a critical step. Rather than anchoring their calculations to real local sea level measurements, they assume that today’s sea level equals a global reference surface. That shortcut, the review argues, means the baseline sea level used in the math can end up lower than the true long-term average along any given stretch of coast.
Think of it like a race where the starting line has been quietly moved back. Every runner’s time looks faster than it really is. In flood modeling terms, that means a coastline that is genuinely at risk can appear to have more buffer than it does.
The review raises a pointed question about what happens when future sea level rise projections are then stacked on top of an already-low baseline. If the “zero line” on a flood map is off by nearly a foot, the compounding effect of adding projected rise to an inaccurate starting point could significantly underestimate real-world danger.
What the Sea Level Studies Actually Found
The scale of the review makes the findings hard to dismiss as a niche methodological complaint. Seeger and Minderhoud examined nearly four hundred peer-reviewed papers — a substantial cross-section of the published science on coastal hazards over a 16-year window.
| Detail | Finding |
|---|---|
| Papers reviewed | 385 coastal hazard studies |
| Time period covered | 2009 to 2025 |
| Share with data handling issues | More than 99% |
| Researchers | Katharina Seeger and Philip Minderhoud |
| Institution | Wageningen University & Research |
| Nature of the error | Sea level and land elevation data handled in ways that can distort results |
The key issue is what researchers call the baseline — the reference point from which sea level rise is measured. When local measurements are ignored in favor of a generalized global surface, the starting elevation used in flood projections can be lower than reality. That gap, even if it seems small in isolation, matters enormously when you are trying to determine whether a neighborhood will flood in 2050 or 2075.
Why This Could Change the Map of Coastal Risks
Coastal hazard assessments don’t just sit in academic journals. They feed directly into flood maps, insurance models, infrastructure planning decisions, and government policies about where it is — and isn’t — safe to build.
If those assessments have been systematically understating risk because of a baseline error, the practical consequences could be wide-ranging:
- Flood maps used by local governments and emergency planners may be drawing risk boundaries in the wrong places
- Coastal areas that appear to have a comfortable margin of safety on paper may actually be far more vulnerable to storm surge and chronic inundation
- Infrastructure investments and development decisions made using these studies could be based on overly optimistic assumptions
- Communities living near coastlines may have been given a false sense of security about their long-term exposure
The review does not argue that every study is wrong in the same way or to the same degree. But the consistency of the finding — more than 99% of papers showing problematic data handling — suggests this is not an isolated mistake. It points to a widespread methodological habit that has gone largely unexamined across the field.
The Part of This Story Most Reports Are Missing
There is a tendency, when a study like this surfaces, to focus on the drama of the error and move on. But the more important question is what comes next for the science itself.
The review by Seeger and Minderhoud represents a peer-reviewed challenge to the methods used across hundreds of published papers. That kind of systematic audit is rare and valuable — it gives the scientific community a documented basis for revisiting how sea level baselines are established and applied.
The concern is not that sea level rise is being fabricated or exaggerated in a general sense. The concern is more precise: that the reference points used to anchor projections to real-world conditions have been inconsistently or incorrectly applied, which can make specific coastlines look safer than local conditions warrant.
For anyone living near the coast, that distinction matters. Global averages are useful for broad policy conversations. But when a city is deciding whether to build a seawall, elevate roads, or rezone a flood-prone neighborhood, the local baseline is everything.
What Happens Next for Coastal Science
The publication of this review puts pressure on researchers, journals, and policymakers to take a closer look at how existing coastal hazard assessments were constructed. Studies that inform active flood maps or infrastructure plans may warrant particular scrutiny.
For the broader scientific community, the findings highlight the importance of anchoring sea level projections to verified local measurements rather than relying on global reference surfaces as a default. Whether that leads to formal re-evaluations of existing studies, updated methodological standards, or revised risk maps has not yet been confirmed.
What is clear is that a finding of this scale — touching more than 99% of nearly 400 published papers — is not something the field can easily set aside.
Frequently Asked Questions
Who conducted this research into sea level study errors?
The review was conducted by Katharina Seeger and Philip Minderhoud of Wageningen University & Research.
How many studies were examined in the review?
The researchers reviewed 385 coastal hazard papers published between 2009 and 2025.
What percentage of studies had the data handling problem?
More than 99% of the papers reviewed handled sea level and land elevation data in ways that can distort results, according to the analysis.
What exactly is the baseline error the review identified?
Many studies assume today’s sea level equals a global reference surface rather than using local measurements, which can make the starting point for flood projections lower than the real long-term average along a coast.
Does this mean existing flood maps are wrong?
The review suggests many assessments may understate risk for certain coastlines, but whether specific flood maps will be formally revised has not yet been confirmed.
Why does a small baseline error matter so much?
Because future sea level rise projections are added on top of the baseline — if the starting point is too low, the projected risk levels will also be too low, potentially by a significant margin.


Leave a Reply