
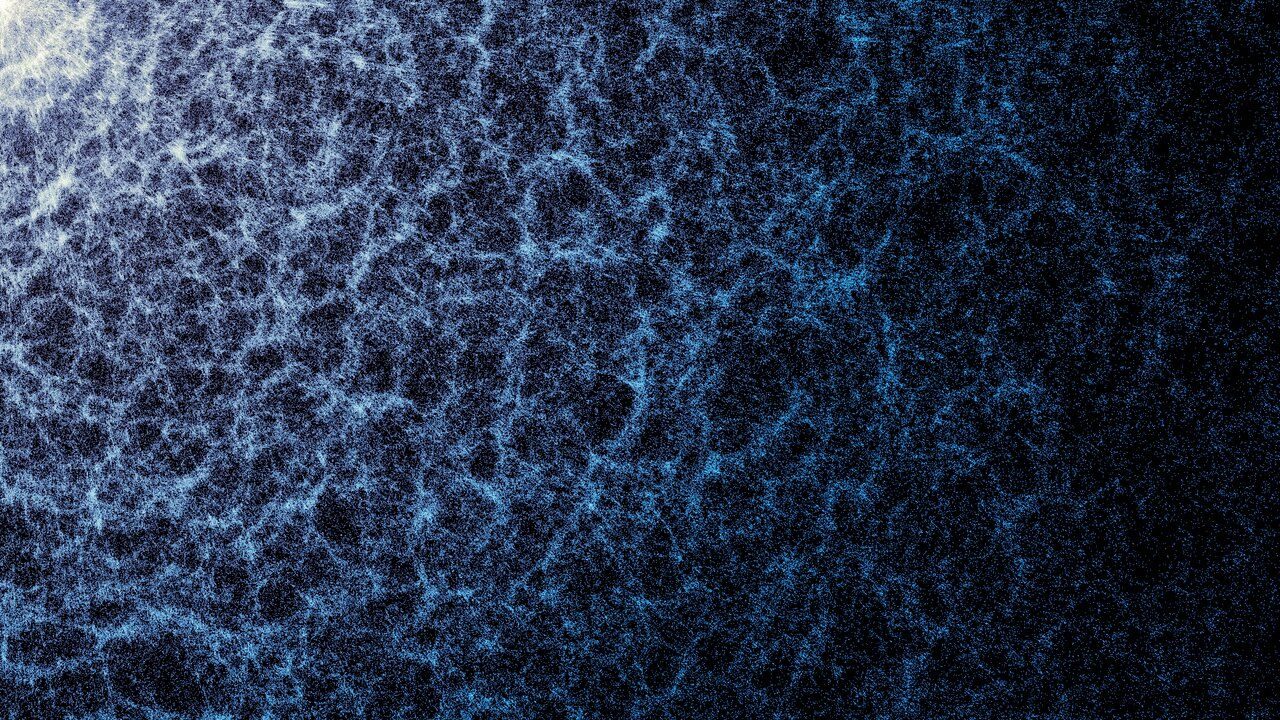
Forty-seven million galaxies, mapped in three dimensions, stretching across billions of light-years of space — and this is only the beginning. Scientists have produced the largest 3D map of the universe ever created, offering humanity its most detailed and sweeping view yet of the cosmic web we call home.
The image, shared on April 17, 2026, captures just a small portion of what the full dataset contains. What’s visible is breathtaking: a vast, web-like structure of galaxies threaded together by gravity across unimaginable distances. And behind that single image lies years of meticulous observation and data collection on a scale that has never been attempted before.
This is not just a pretty picture. It is a scientific instrument — one that researchers are using to probe some of the deepest questions in cosmology, including how the universe evolved, how fast it is expanding, and what role mysterious forces like dark energy have played in shaping everything we can see.
What the DESI Map Actually Shows
The map was produced by the Dark Energy Spectroscopic Instrument, known as DESI, in its year-five data release. The collaboration involves researchers from the Department of Energy, Kitt Peak National Observatory, NOIRLab, the National Science Foundation, and AURA, among others.
At its core, DESI is designed to measure how galaxies are distributed through space — not just where they appear on a flat image, but how far away they are, giving scientists a true three-dimensional picture of the universe’s large-scale structure.
The resulting map spans an extraordinary range of cosmic time, reaching from our own galactic neighborhood all the way back to what astronomers call cosmic noon — a peak period of star formation and galaxy activity billions of years ago. Seeing that full arc of cosmic history in a single dataset is something that simply wasn’t possible before this project.
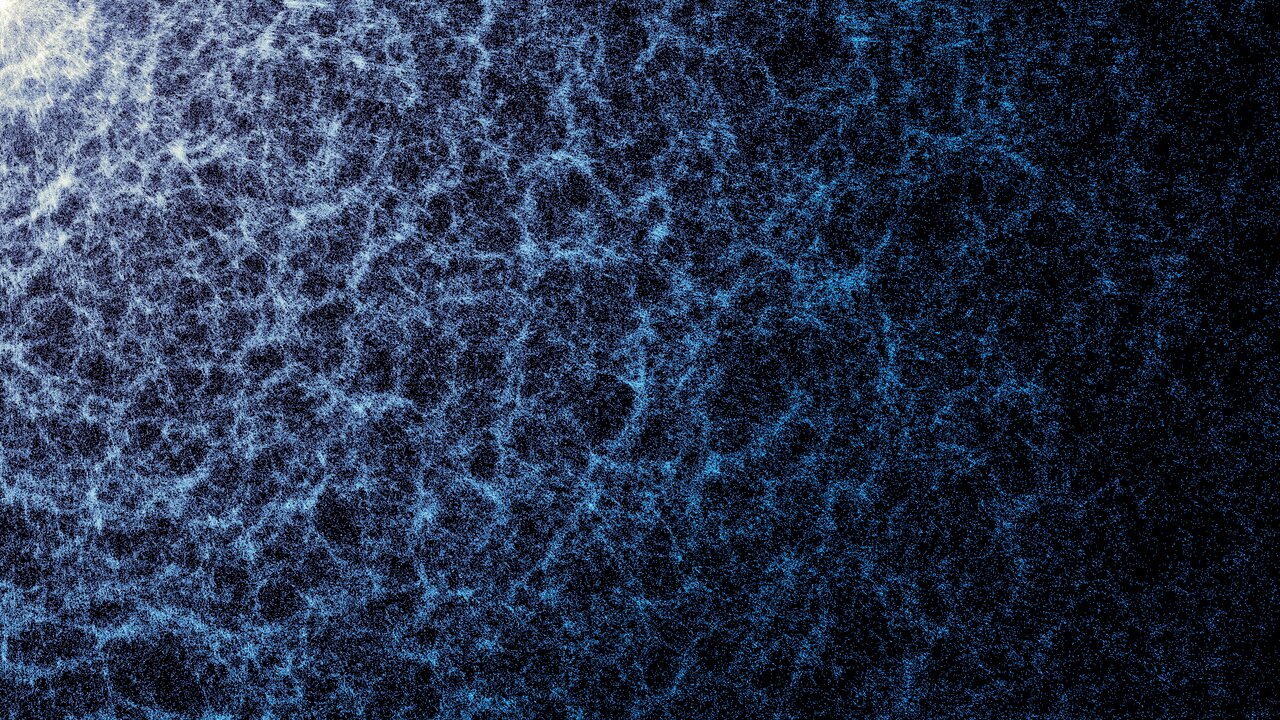
The web-like pattern visible in the map reflects how matter is distributed on the largest scales. Galaxies cluster along vast filaments, separated by enormous voids. This structure — the cosmic web — emerged from tiny fluctuations in the early universe and has been shaped ever since by gravity, dark matter, and dark energy.
Key Facts About the Largest 3D Map of the Universe
| Detail | Information |
|---|---|
| Number of galaxies mapped | 47 million |
| Type of map | Three-dimensional (3D) |
| Instrument used | Dark Energy Spectroscopic Instrument (DESI) |
| Data release stage | Year five |
| Date shared publicly | April 17, 2026 |
| Range covered | From the Milky Way to cosmic noon |
| Collaboration partners | DOE, KPNO, NOIRLab, NSF, AURA |
- The map reveals the large-scale structure of the universe in unprecedented detail
- It captures the cosmic web — filaments of galaxies separated by vast empty voids
- The dataset spans from our local universe back to a period of peak cosmic activity
- Image processing was carried out by M. Zamani at NSF NOIRLab
- The full map is far larger than any single image can convey — what has been shared publicly is described as a small portion
Why This Matters Beyond the Spectacle
It’s easy to look at an image of 47 million galaxies and feel a sense of awe that stays purely aesthetic. But the scientific stakes here are genuinely significant — and they connect to questions that affect our fundamental understanding of reality.
DESI was built specifically to study dark energy, the mysterious force thought to be driving the accelerating expansion of the universe. By mapping how galaxies cluster and how those clusters have changed over billions of years, researchers can trace the fingerprints of dark energy across cosmic time.
The map also helps scientists study baryon acoustic oscillations — subtle patterns in the distribution of galaxies that act like a cosmic ruler, allowing researchers to measure distances across the universe with remarkable precision. These measurements feed directly into calculations of the Hubble constant, the rate at which the universe is expanding, which remains one of the most debated numbers in modern physics.
In other words, this map is not just a record of where galaxies sit. It is a tool for testing and potentially rewriting our best theories about how the universe works.
The Part of This Story Most Reports Are Missing
What often gets lost in the coverage of images like this is the sheer scale of the observational effort required to produce them. Mapping 47 million galaxies in three dimensions means measuring the distance to each one — a process that requires analyzing the spectrum of light from every single galaxy to determine how much it has been redshifted by the expansion of the universe.
DESI can observe thousands of galaxies simultaneously, which is what makes a project of this scale even remotely achievable. But it still represents years of nightly observation from Kitt Peak National Observatory in Arizona, combined with enormous computational resources to process and validate the data.
The year-five designation is also worth noting. This is not a finished project — it is a milestone in an ongoing survey. Each additional year of data adds more galaxies, extends the range of the map, and sharpens the statistical precision of the measurements scientists can extract from it.
What Comes Next for DESI and Cosmic Mapping
The release of the year-five map marks a significant moment, but the work is far from over. DESI continues to observe, and future data releases are expected to push the boundaries of the map even further — both in terms of the number of galaxies included and the depth of cosmic time covered.
Researchers will use the existing dataset to refine measurements of dark energy and test whether Einstein’s theory of general relativity holds up at the largest scales in the universe. Any deviation from predictions could point toward entirely new physics.
For now, the image stands as the most complete picture humanity has ever assembled of the universe we inhabit — a reminder that even 47 million galaxies represent only a fraction of what exists beyond what we can currently see or measure.
Frequently Asked Questions
What is the DESI 3D map of the universe?
It is the largest three-dimensional map of the universe ever created, produced by the Dark Energy Spectroscopic Instrument and containing 47 million galaxies.
When was the map shared publicly?
The map was shared on April 17, 2026, as part of DESI’s year-five data release.
What does “cosmic noon” mean?
Cosmic noon refers to a peak period in the universe’s history when star formation and galaxy activity were at their most intense, billions of years ago. The DESI map reaches back that far in cosmic time.
Who produced the DESI map?
The map was produced by the DESI Collaboration, with contributions from the Department of Energy, Kitt Peak National Observatory, NOIRLab, the National Science Foundation, and AURA.
Why does mapping galaxies in 3D matter?
A 3D map allows scientists to study how galaxies are distributed through space over time, which helps them measure the effects of dark energy and test fundamental theories about how the universe expands.
Is the full map visible in the released image?
No — the image shared publicly represents only a small portion of the full dataset. The complete map is significantly larger than any single image can show.


Leave a Reply