
Every time a massive earthquake strikes, our planet doesn’t just shake — it rings. Like a struck bell, Earth vibrates with slow, planet-wide pulses that travel through thousands of miles of rock, metal, and heat. And now, for the first time, scientists have used those vibrations to build a full 3D map of Earth’s deep interior — revealing structures beneath Africa and the Pacific that dwarf Mount Everest in scale.
The findings challenge what geologists thought they understood about the relationship between heat and seismic energy deep inside the planet. The places where waves slow down are not necessarily the same places where waves lose energy — and that distinction turns out to matter enormously for how we understand what’s happening far beneath our feet.
The study was published online on January 22, 2025, in the journal Nature, and the implications are already reshaping how researchers think about Earth’s deep mantle.
How Scientists Turned Earthquakes Into a Map of the Deep Earth
The research team, led by Sujania Talavera-Soza and including Laura Cobden, Ulrich H. Faul, and Arwen Deuss, analyzed 104 large earthquakes that occurred between 1975 and 2018. The collaboration spanned Utrecht University, the Massachusetts Institute of Technology, and Vassar College.
Their focus was a phenomenon called normal modes — the slow, resonant vibrations that ripple across the entire planet after a major seismic event. Think of it as Earth humming to itself after a powerful strike. By carefully tracking how those modes split apart and fade over time, the team was able to construct a new global model called QS4L3.
What makes QS4L3 different from previous models is its depth and scope. Earlier 3D maps of seismic attenuation — the technical term for how waves lose energy as they travel — had mainly covered the upper mantle. This new model reaches from the upper mantle down into the lower mantle, covering continent-scale patterns across the entire globe.
That’s a significant leap. The lower mantle begins roughly 410 miles below the surface and extends to about 1,800 miles down. Almost everything we know about it comes from indirect evidence, which is exactly why a map built from 43 years of earthquake data is so valuable.
What “Attenuation” Actually Means — and Why It’s the Key to This Discovery
Seismic waves behave differently depending on what material they’re passing through. In hot, soft, or partially molten rock, waves lose energy faster — they attenuate more strongly. In cold, rigid rock, they travel with less energy loss.
Scientists have long used wave speed to infer temperature and composition deep underground. Slow waves typically suggest hotter material; fast waves suggest cooler, denser rock. But the new research reveals something unexpected: attenuation and wave speed don’t always point to the same locations.
In other words, the places where waves are most weakened in the deep mantle are not always the same places where waves are slowest. That mismatch suggests the deep mantle is more complex — and more varied in its composition — than existing models assumed.
The Structures Beneath Africa and the Pacific That Change Everything
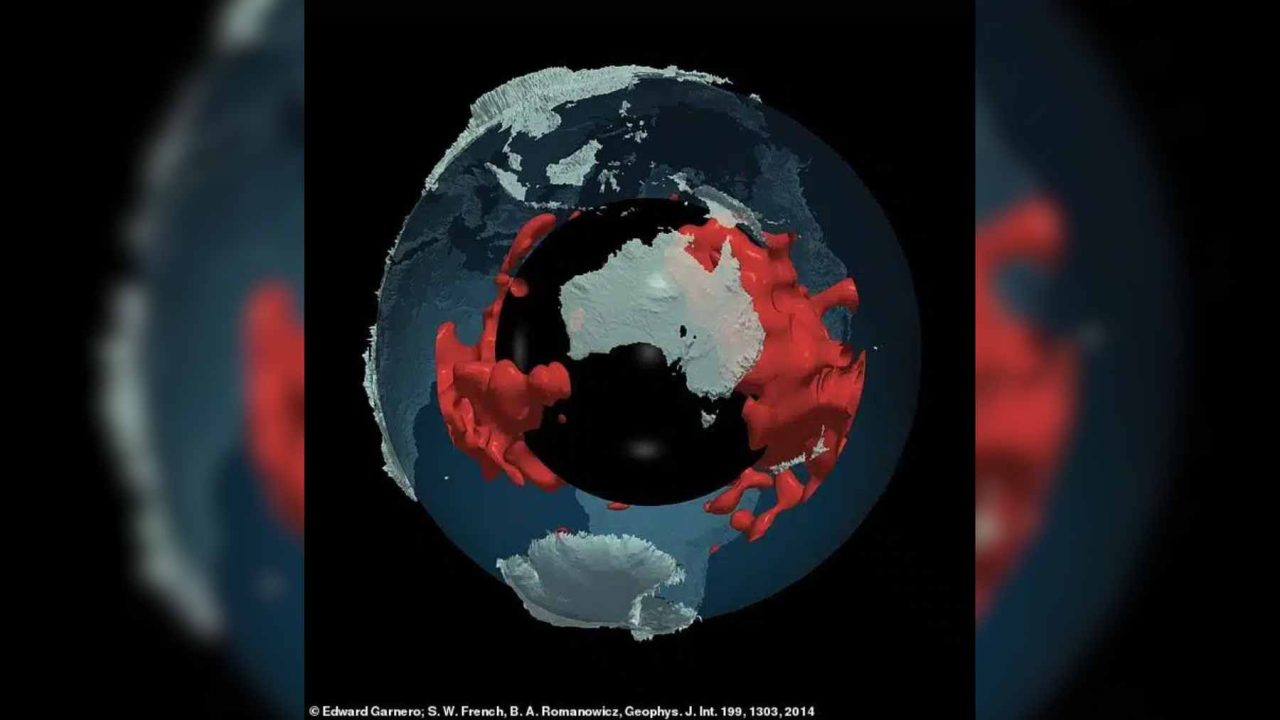
The most striking findings in the new map involve two enormous regions of anomalous material in the deep mantle: one beneath the African continent and one beneath the Pacific Ocean. These structures, known in geoscience as Large Low-Velocity Provinces (LLVPs), have been known to exist for some time — but their true character has remained poorly understood.
What the new attenuation map reveals is that these features are not just slightly different from the surrounding mantle. They are extraordinarily large, and the way they interact with seismic energy is distinct from what wave-speed maps alone suggested. Their scale puts surface geography in perspective — the vertical and lateral dimensions of these provinces make Mount Everest’s 29,032-foot height look modest by comparison.
The fact that attenuation patterns don’t perfectly overlap with velocity anomalies in these regions points toward complex variations in temperature, mineral composition, or the presence of partial melt deep in the lower mantle — factors that wave speed alone cannot fully capture.
Key Facts About the QS4L3 Study
| Detail | Information |
|---|---|
| Lead researcher | Sujania Talavera-Soza |
| Co-researchers | Laura Cobden, Ulrich H. Faul, Arwen Deuss |
| Institutions involved | Utrecht University, MIT, Vassar College |
| Earthquakes analyzed | 104 large earthquakes |
| Time period covered | 1975 to 2018 |
| Model name | QS4L3 |
| Published | January 22, 2025 (Nature, doi.org/10.1038/s41586-024-08322-y) |
| Key advance | First global 3D attenuation map extending into the lower mantle |
Why This Matters Beyond the Lab
Understanding Earth’s deep interior isn’t just an academic exercise. The dynamics of the mantle drive plate tectonics — the slow movement of the crustal plates that causes earthquakes, builds mountain ranges, and triggers volcanic eruptions. The large anomalous structures beneath Africa and the Pacific are believed to influence where mantle plumes rise, which in turn affects hotspot volcanism at the surface.
Better attenuation maps also improve the accuracy of seismic hazard models. When scientists understand how energy moves and dissipates through different regions of the mantle, they can build more precise models of how seismic waves from large earthquakes will travel — and where the shaking will be strongest.
The QS4L3 model also sets a new baseline. Future studies can compare against it, test competing theories about mantle composition, and refine our understanding of how the planet has evolved over billions of years.
What Researchers Will Be Looking at Next
The publication of this model opens several new lines of inquiry. The mismatch between attenuation and velocity in the deep mantle now needs explanation — researchers will likely investigate whether variations in mineral grain size, volatile content, or partial melt can account for the patterns seen in QS4L3.
The model currently focuses on continent-scale features, meaning finer details remain unresolved. As more earthquake data accumulates and computational methods improve, higher-resolution versions of this kind of map will likely follow — potentially revealing even more surprising structures in the planet’s hidden interior.
For now, the takeaway is clear: Earth’s deep interior is stranger and more varied than its surface suggests, and the planet’s own vibrations are the best tool we have for finding out what’s really down there.
Frequently Asked Questions
What is the QS4L3 model?
QS4L3 is a new global 3D model of seismic attenuation — how earthquake waves lose energy as they travel — built by researchers from Utrecht University, MIT, and Vassar College using data from 104 large earthquakes between 1975 and 2018.
What makes this study different from previous research?
Earlier global 3D attenuation maps had mainly covered the upper mantle. This study is the first to extend that mapping into the lower mantle on a global scale.
What are the large structures found beneath Africa and the Pacific?
They are massive anomalous regions in the deep mantle, known as Large Low-Velocity Provinces, whose scale vastly exceeds the height of Mount Everest and whose behavior in the new attenuation map differs from what wave-speed data alone had suggested.
Why don’t wave speed and attenuation point to the same locations?
The study found that in the deep mantle, the places where waves lose the most energy are not always where waves travel slowest — suggesting complex variations in temperature, composition, or partial melt that speed alone cannot capture.
When was this research published?
The paper was published online on January 22, 2025, in the journal Nature, with the doi reference doi.org/10.1038/s41586-024-08322-y.
What were the “normal modes” the researchers studied?
Normal modes are the slow, planet-wide vibrations triggered by large earthquakes — essentially the way Earth resonates after a major seismic event — which carry information about the interior structures the waves passed through.


Leave a Reply